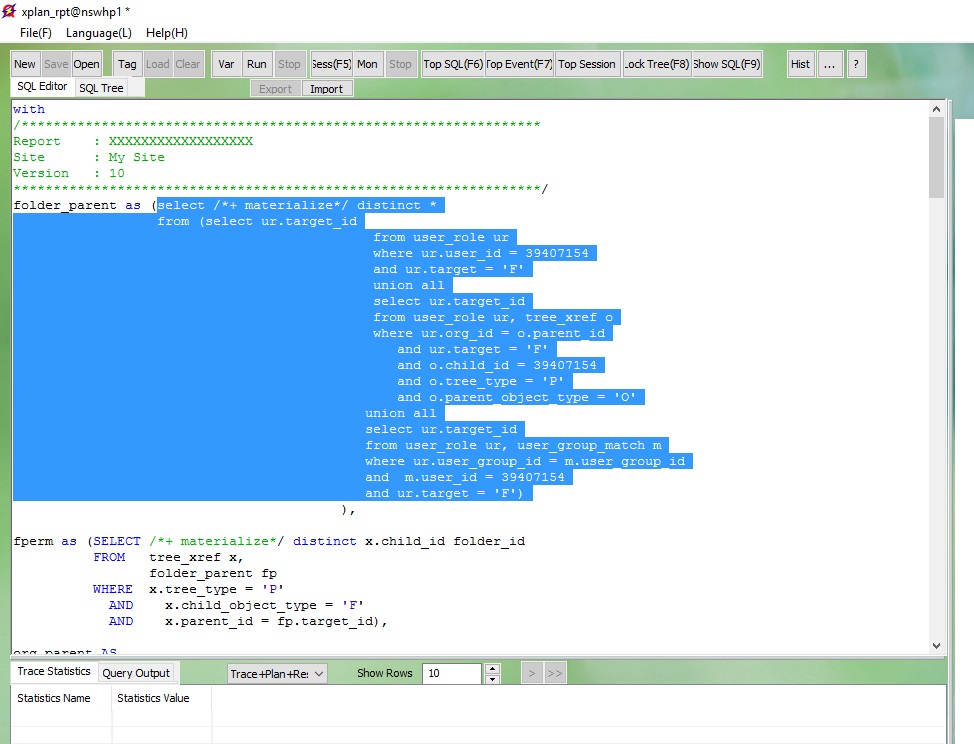
Run SQLInput SQL Text:After you login your database successfully, you can run a SQL and check its performance statistics data and execution plan. In the SQL Editor, input the SQL text you want to run (without ;). Or if you have SQL text input in the editor, you just want to run a part of, then select the part you want to run.
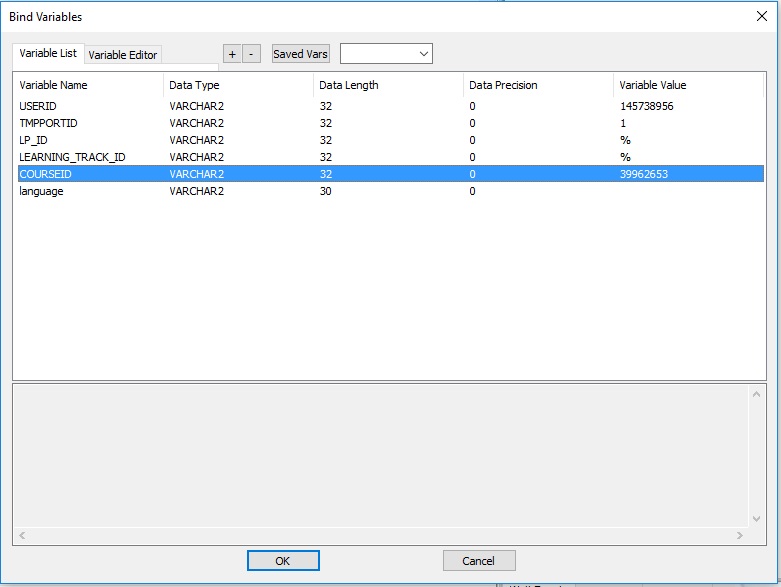
Bind Variables:
If your SQL need to bind variables, you just need to click "Var" button, and it will popup a window to input bind variables's name, data type and value.
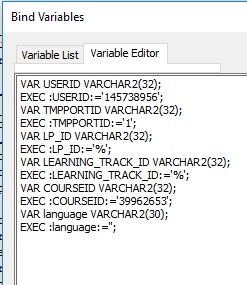
Tips: If you want these bind varibles to be used in SQL*Plus, click "Variable Editor", it will generate SQL*PLus variables. Or, if you already have SQL*Plus bind variables, input it the variable editor, then click "Variable List", it will generate variable list automatically.
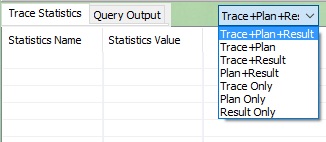
Tips: If you don't want to input the bind variabel name manually, or you forget to input some variables. You will get message box ask you if you want leave those variable as default (VARCHAR2 data type, NULL value). If you click "No", the bind variable window will be popup, and all missed variables has been listed as default. Then you can change them. Choose Display Result:In the central of left panel, you have a choice to decide what kind of result should be displayed. There are,
Note: This tool is for SQL tunning purpose, it will only show NUMBER, VARCHAR2/CHAR, DATE/TIMESTAMP result, and will leave other data type as blank.
How many rows to be fetchedIf you chose to show the query result, you can also decide how many rows need to be fetched. The default value is 10. -1 stands for fetching all rows.
Run SQL and Show Result:
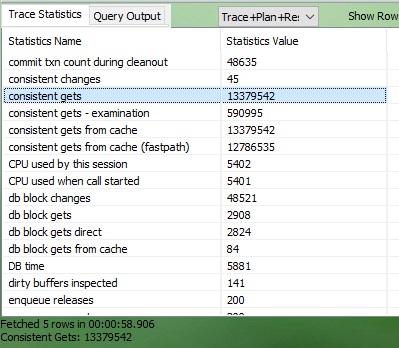
Click "Run" button, the SQL will be sent to the database to run, and you will get all result depending on your choice once it finished. Performance Statistics DataIf you chose to show performance statistics data, it will be shown in the first tab on the bottom of the left panel. These statistics data such as "Consistent Gets", "Physical Reads", "DB Time" will let you decide what is the performance of your query.
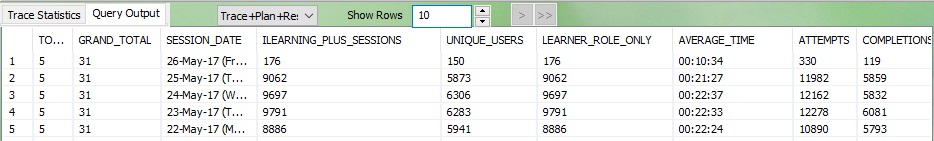
Query ResultIf you chose to show the query result, then click "Query Output" tab on the bottom of the left panel. You can show number of rows you have set. If it has more than the rows can be shown in a screen, you can click
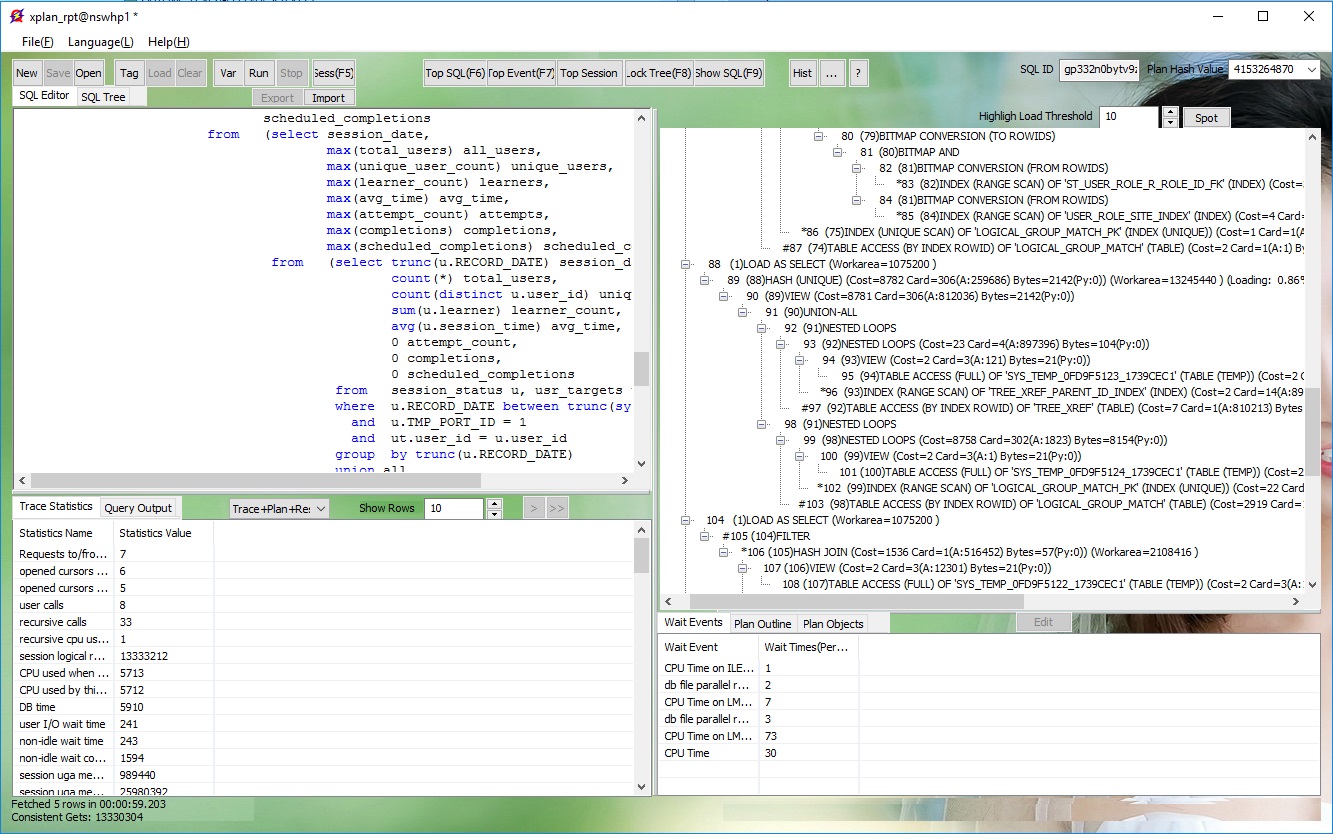
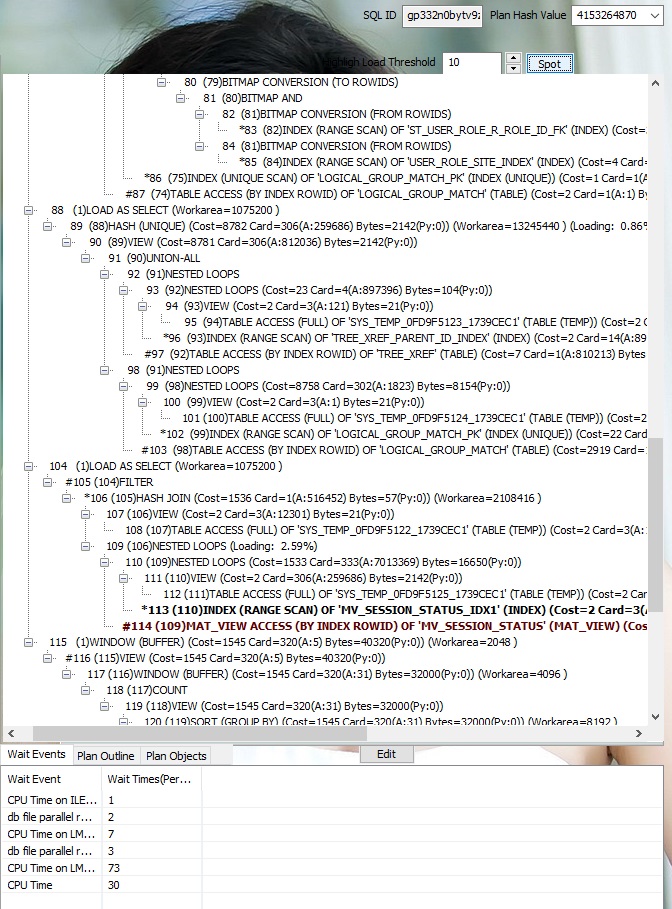
Execution PlanIf you chose to show the execution plan, The plan and its statistics data will be shown on the right panel. With the execution plan and its statistics data, you can identifiy the performance bottlenect of your SQL roughly.
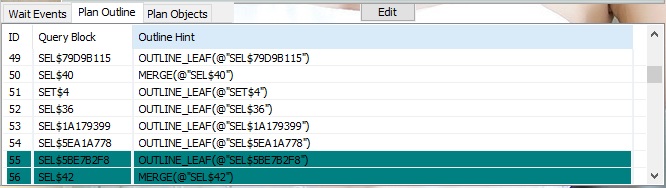
The operations having high waits will be highlighted in the plan tree. The highligh threshold value can be set in the right top box. Tips: Click "Spot", it will navigate to the highlighted operation quickly. This will help you identify the performance bottleneck quickly. A summary waits event report will also be shown on the bottom of the plan tree. Plan OutplineTo show the outpline of the execution plan, click "Plan Outline" tab.
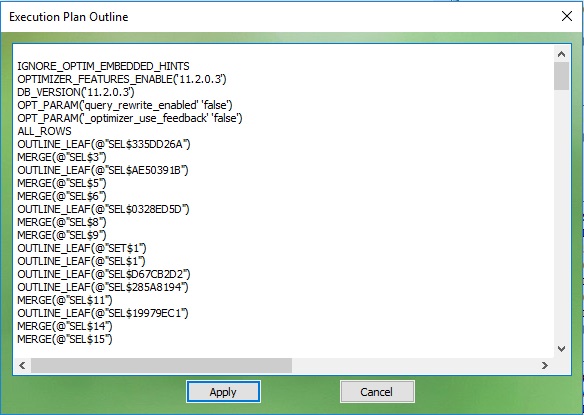
You can edit the outline of the plan. To do this, click "Edit" button on the top of the outline panel. It will popup an editor window. Once you made your changes, click "Apply", it will generate a SQL Profile to apply the changed outline to the SQL.
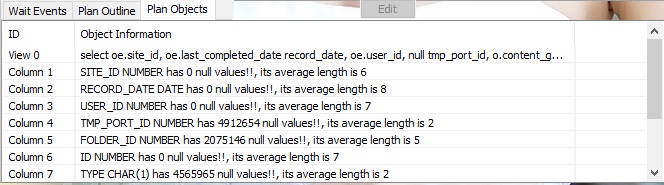
Plan ObjectClick "Plan Object" tab, it will show you the related database objects of currently selected plan operation. If you click other plan operations, the contents of this table will also be changed corresponsely.
SummaryHere is what your screen looks like after you run a SQL.
|
 Tips: When click a branch of the plan tree, you will be navigated to the related outline entries automatically. Vice versa, when you click the outline entry, you will be navigated to the related plan branch quickly.