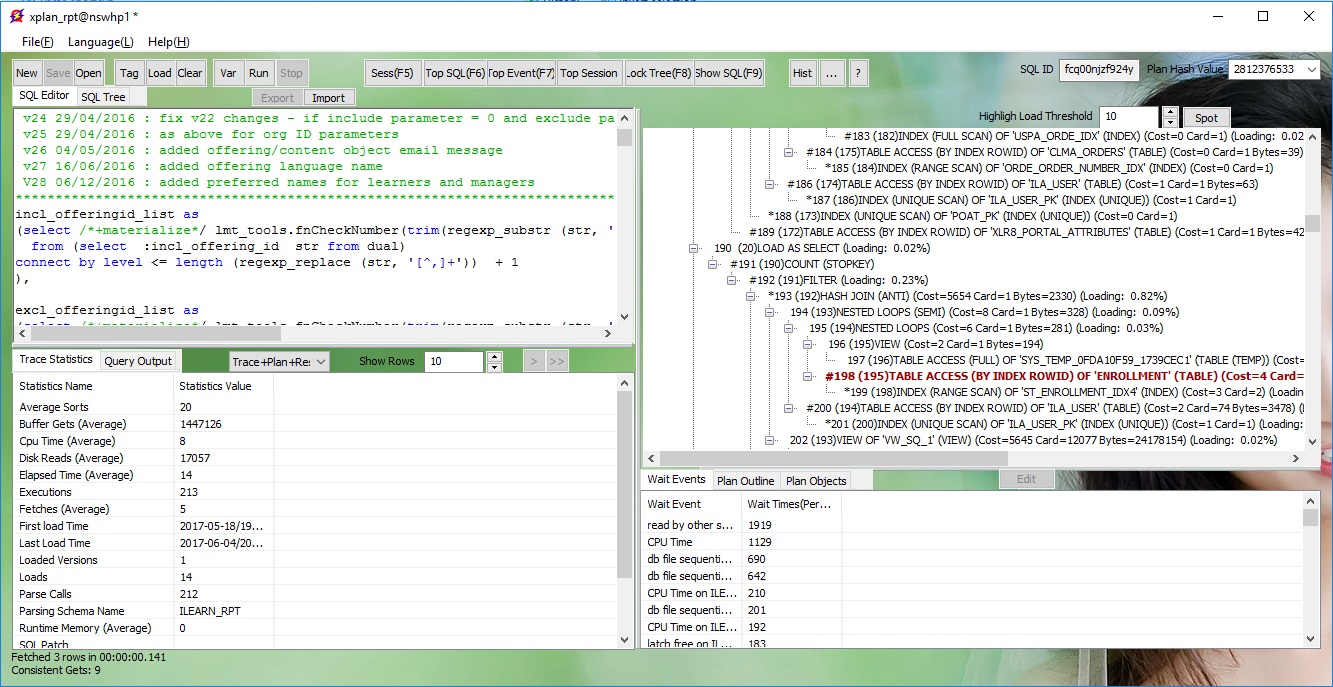
Analyze SQL (Find the bottleneck)If you have a SQL need to be tuned, how to find the performance bottlenect, or say, how to analyze the SQL. This is the most important step to tune a SQL. Check Execution PlanSometimes, you can tell the bottlenect from its execution plan. In below execution plan view, click "Spot" button, it will navigate to the high loading operations of this plan.
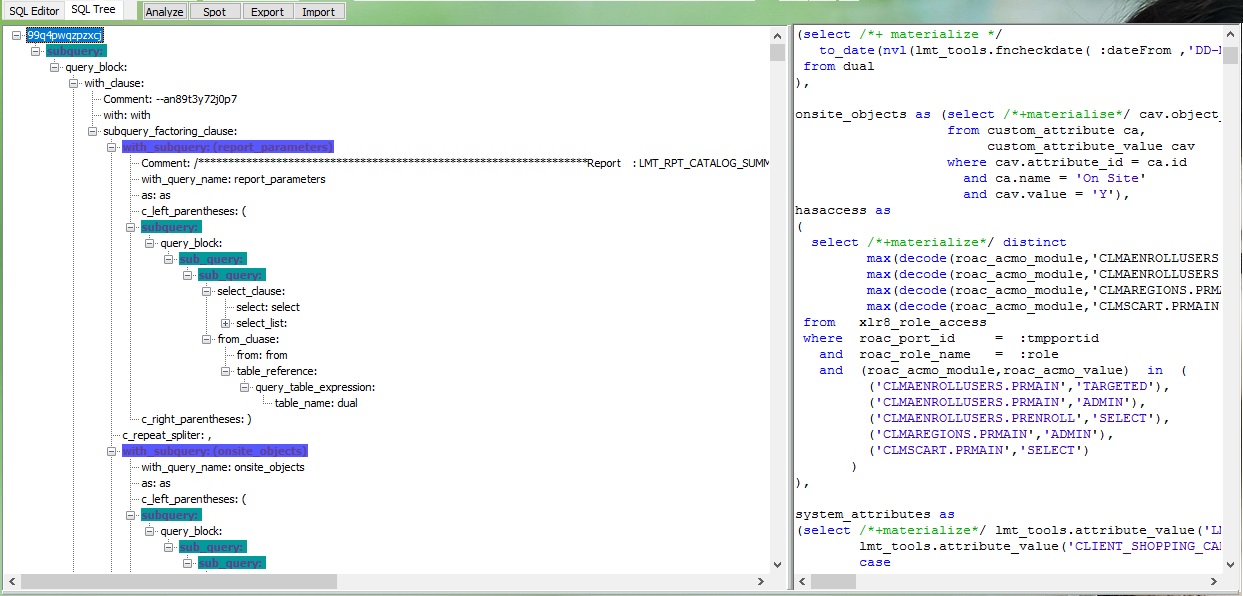
While an important prerequisite of this way is that all statistics data is correct. In many cases, we cannot tell the bottlenect from the excution plan, especially for those complicated SQL. Actually, in these cases, the real performance killer exists in one of the subquery in the entire query. If you can find out this simplified subquery and tune it, your problem will be solved. This tool provides the best/simplest way for you to find out the problem. It can parse the SQL structure and go through all subquery to analyze their performance. You will get clear view of the performance of each parts of your SQL. Parse SQL TreeOnce you input the target SQL in the editor, or you got it from any other ways, like top SQL, top session and so on (Please refer to this document, http://www.SQLFast.com/documents/sql_details.html). Then, click "SQL Tree" to parse the SQL structure. The parsed SQL tree will be shown on the left of the editor.
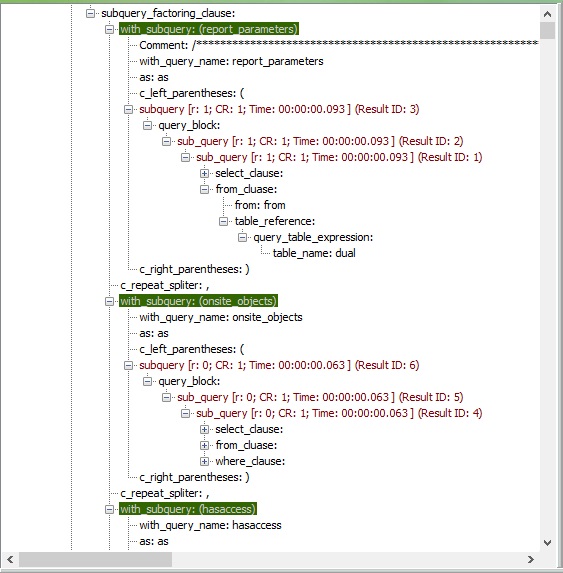
Initially, 2 parts in this tree will be highlighted: WITH inline view and subquery. Click any subquery, the constructured SQL text will be shown in the editor immediately. Analyze SubqueriesTo go through the subqueries and analyze their performance, click "Analyze" button. Tips: You can set the timout threshold to control maximum time a subquey could be running. And you can also control the behavior of the analyzer when the subquery running timeout, continue or stop after failed specific times. Once analyze process finished or aborted, the subquery node in the SQL tree will be updated with their performance data. Those long running subqueries will be highlighted.
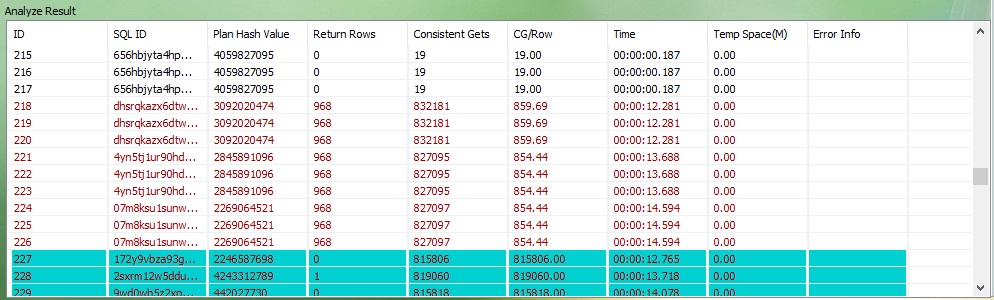
And you can also see the performance data of each subquery in the result table. And those potetianl candidates have been hightlighted. The highlight rule is based on the running time and Consistent Gets per row.
When you click one of the row in the table, the SQL tree will be navigated to the corresponding node, and the subquery SQL text will be shown in the editor. If you want to get execution plan details of a subquery, double click the row in the table, its execution plan will be displayed in the plan view. Tips: You can export your analyze result to a file, or import an exported analyze result from a file. To do it, click "Export" or "Import" button.
|